Home
TradingSystems
Information, charts and tools for investors
|
|
 |
Economic indicator: US ISM Manufacturing: New Orders Index©
Statistics to forecast financial S&P 500 index, drawing the indicator: US ISM Manufacturing: New Orders Index©.
In the space below are visible: the historical monthly diagram of the S&P 500 stock index from the beginning of the provided indicator, the weekly chart of the last 10 years and the daily chart for the last year, with the economic indicator NAPMNOI.
For every graph there are represented:
- the S&P500 index, with open, max, min and close values recorded in the market for each month, week or day (green and dark red bars);
- the course of the economic indicator (blue line);
- the derivative of the indicator that puts forward the market trend (orange line);
- a line of reference with 6% annual yield (green line), useful to compare charts with different axis scale.
On the left side of every diagram there is the axis of the S&P500 index value, while on the right there is the scale of the economic indicator. The diagrams come daily dawned.
All data are showed reflecting the dates when they were available and not the dates they referred to.
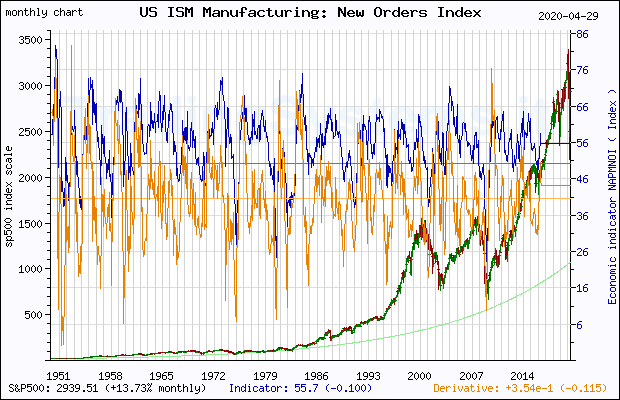 Full historical monthly quote chart of S&P 500 with the indicator NAPMNOI
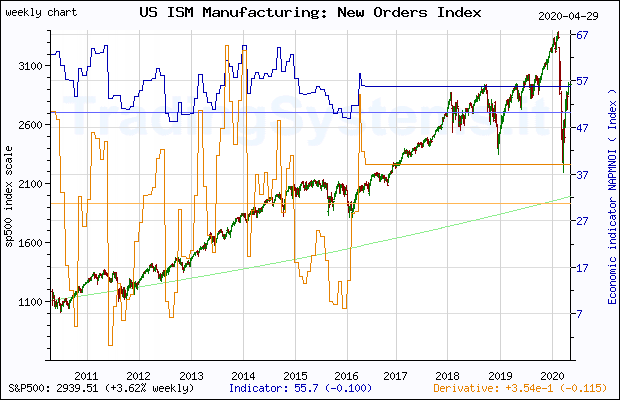 Ten years weekly quote chart of S&P 500 with the indicator NAPMNOI
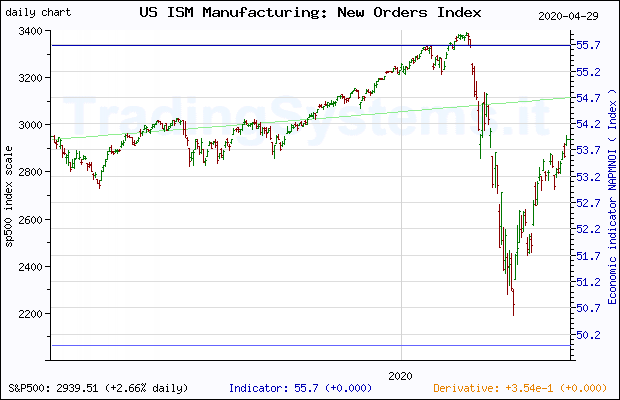 One year daily quote chart for the last year of S&P 500 with the indicator NAPMNOI
For further information you can visit the website of Federal Reserve Bank of St.Louis, in the page dealing with the economic indicator NAPMNOI
|
Would you like to be available on the site other information? Demand them here .
We will try to realize the best ideas that will come to us proposed. | |
|