Home
TradingSystems
Information, charts and tools for investors
|
|
 |
VAR: Value at Risk of the Trading System in Real Estate Funds
The management of the savings is mainly based on the appraisal of the relationship yield/risk. In this view the diversification in financial instruments between not correlated ones plays the role to diminish the risk of the portfolio.
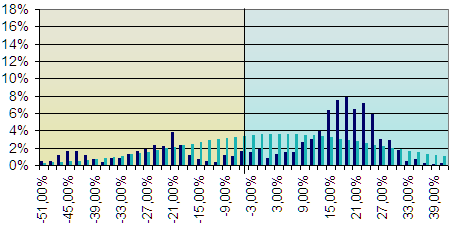
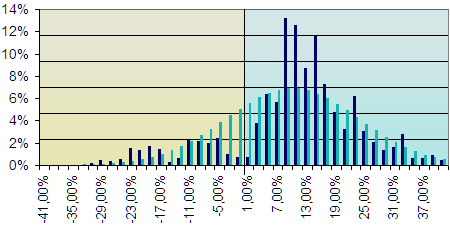
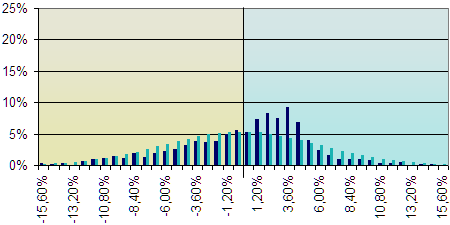
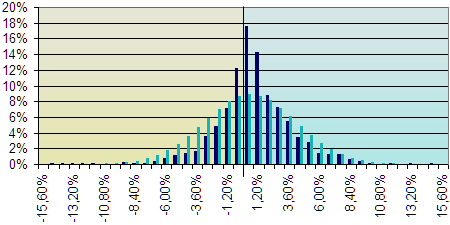
The composition of the portfolio generally is subdivided in a share component and a bond one, that are little correlated between them. During the last few years the consideration regarding a third pillar on which basing the management of the financial investments is growing: the one of the investments in the real estate industry, that is also little correlated to the others two members. Now we introduce a short statistic explaning of the fields about share and real estate.For a corrected risk assessment of a financial instrument, it often comes used the VAR (Value at Risk), that expresses the maximum loss that you can be attended in a determined interval of time T with a fixed probability P. For calculation of the VAR, knowing the historical data of the financial instrument, it comes considered the gain/losses realized in all the past ranges of time of the considered duration.A histogram is plotted where, in correspondence of the gain/losses percentage that are placed along the X axis, it is estimated the relative probabilities of occurrence. It is approximated therefore the histogram with an opportune probability distribution, often the Gaussian one, and it is estimated the value of the loss calculated when the integral of the negative tail of the distribution (that is probability that losses are more then this one) is equal to one less a fixed probability P.In the event in which it comes used the Gaussian distribution, it's possible through the average and the standard deviation of the gain/losses realized percentage to calculate more simply the VAR, since exist the tables of correspondence between the range of integration centered around the average with a semiamplitude of k times the standard deviation and the value of probability calculated from the integral.Therefore the Value at Risk in a time T with probability of 99% is estimated simply like: VAR% = average - 2.33*std.dev.The Value at risk can also be expressed in absolute terms, multiplying VAR% for the invested amount.Now they come introduced the obtained histograms of the historical course of the Trading System in Real Estate Closed Funds applied to a beginning amount of one million euro, considering a temporal interval of 1 year and of 1 month (read the bottom disclaimer).They come therefore introduced the annual medium yield and the VAR, confronting the values with those proceeds from the FTSE IT All Share (ex MIBTEL) Total Return index (that reassumes the course of the Italian stocks market including in the calculation the dividends, therefore total return) and from the ETF Euromts Global L [EMG] (that represents a diversified investment in European obligations with a low management commission).The following results introduced come quarterly recalculated. At the moment the historical data considered is from 01/01/2002 to the 30/09/2010 while it starts from the beginning of quotations (27/04/2004) for the EMG. It turns out therefore obvious that the greater performances (annual medium yield of 9,95%) of the Trading System in real estate closed funds regarding the stock market (of -0,47%) are also obtained with a clearly inferior risk, since in 1 year the Value at Risk of the TS is with probability of 99% of only -20,95%, while the VAR of FTSE IT All Share (ex MIBTEL) Total Return is of -50,04%.
Also in the comparison with the ETF Bond, the trading system in real estate having a bit grater VAR, practically obtains a double yield.
If you want to receive further information, you can email us.
|
Would you like to be available on the site other information? Demand them here .
We will try to realize the best ideas that will come to us proposed. | |
|
![VAR Etf Euromts Global L [EMG] in 1 year](/images/var1a_emg.png)
![VAR Etf Euromts Global L [EMG] in 1 month](/images/var1m_emg.png)