Home
TradingSystems
Information, charts and tools for investors
|
|
 |
Real Estate Fund: QFATL2
Name of the real estate fund: Fondo Atlantic 2 - BereniceExchange Code in the MIV segment of the Italian Stock Market (Alpha Code): QFATL2ISIN code: IT0003855696Internet site: http://www.fondoatlantic2-berenice.it/Date of constitution of the fund: 2005-07-14Date of beginning of the stock quotation: 2005-07-19Previewed date of expiration of the fund: 2012-12-31Number of quotas totals: 600003NAV (Net Asset Value) per quota at the placement date: € 684.000Value of the quota in the stock market at the placement date: € 500.000Value of the quota in the stock market ( 2024-04-18 ): € 62.05The last NAV per quota certified from the independent experts in the financial report relative to 2015-06-30: € 185.026Current NAV = last NAV - proceeds distributed after the 2015-06-30:
€ 185.026Difference between the quote value and the current NAV (discount if negative or appreciation if positive): € -122.976( -66.46% )Capitalization in million euro: 37List of the proceeds (dividends and capital reimbursements as a result of the sale of buildings): | Date of competence | Dividends | % Div. | Repayments | Total proceeds | perc. on the fund value | | 2006-02-06 | 15.05€ | 3.30% | 0.00€ | 15.05€ | 3.30% | | 2006-08-07 | 17.50€ | 3.98% | 2.45€ | 19.95€ | 4.53% | | 2007-02-05 | 29.52€ | 6.01% | 0.00€ | 29.52€ | 6.01% | | 2007-08-27 | 21.59€ | 2.42% | 34.86€ | 56.45€ | 6.33% | | 2008-02-25 | 15.68€ | 2.67% | 0.00€ | 15.68€ | 2.67% | | 2008-12-08 | 0.00€ | 0.00% | 64.35€ | 64.35€ | 12.92% | | 2009-02-09 | 145.75€ | 27.60% | 0.00€ | 145.75€ | 27.60% | | 2009-05-11 | 6.75€ | 1.63% | 0.00€ | 6.75€ | 1.63% | | 2009-08-17 | 4.00€ | 0.97% | 3.92€ | 7.92€ | 1.93% | | 2009-11-16 | 3.50€ | 0.88% | 0.00€ | 3.50€ | 0.88% | | 2010-02-15 | 17.60€ | 4.07% | 48.21€ | 65.81€ | 15.23% | | 2010-05-17 | 2.70€ | 0.78% | 0.00€ | 2.70€ | 0.78% | | 2010-08-16 | 5.00€ | 1.40% | 8.93€ | 13.93€ | 3.90% | | 2011-03-14 | 14.25€ | 4.09% | 6.53€ | 20.78€ | 5.97% | | 2011-05-30 | 9.50€ | 2.92% | 0.00€ | 9.50€ | 2.92% | | 2011-08-22 | 11.00€ | 3.12% | 3.96€ | 14.96€ | 4.24% | | 2012-02-20 | 1.90€ | 0.71% | 3.96€ | 5.86€ | 2.18% | | 2012-05-28 | 7.60€ | 4.22% | 0.00€ | 7.60€ | 4.22% | | 2012-09-10 | 3.70€ | 2.05% | 0.00€ | 3.70€ | 2.05% | | 2012-11-26 | 6.00€ | 4.06% | 0.00€ | 6.00€ | 4.06% | | 2013-02-18 | 0.00€ | 0.00% | 16.50€ | 16.50€ | 8.33% | | 2013-05-20 | 4.00€ | 2.09% | 0.00€ | 4.00€ | 2.09% | | 2013-08-26 | 4.00€ | 2.26% | 0.00€ | 4.00€ | 2.26% | | 2013-11-18 | 4.00€ | 2.18% | 0.00€ | 4.00€ | 2.18% | | 2014-02-24 | 0.00€ | 0.00% | 4.00€ | 4.00€ | 1.94% | | 2014-08-11 | 0.00€ | 0.00% | 51.00€ | 51.00€ | 23.77% | | 2014-12-29 | 0.00€ | 0.00% | 24.00€ | 24.00€ | 16.35% |
|
|
In the below space are available the historical weekly diagram from the beginning of the quotation and the daily one for the last year, of the stock quotations of the real estate closed fund QFATL2.
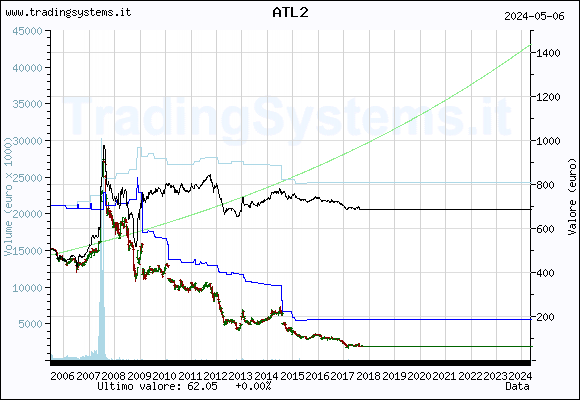 Historical weekly quote chart of the fund QFATL2
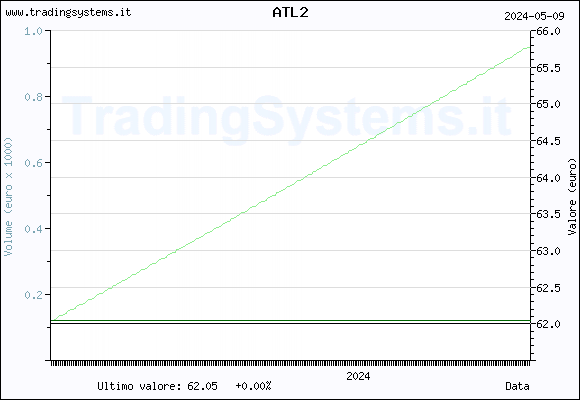 Daily quote chart for the last year of the fund QFATL2
In the left side of every diagram there is the scale of the equivalent value exchanged in the market, expressed in thousands of euros, while to right there is the value of the fund in euro. The diagrams come weekly dawned.
For every graph there are represented the open, max, min and close values recorded in the market for each week or day (green and dark red bars) and the course of the values of the closes added to the distributed dividends (black line), that is the "total return" course of an investment in that fund and the course of an index of reference with 6% annual yield (light green line).
Added two new lines: a dark blue indicates the
adjusted NAV
, which is obtained from the last available NAV for each date by subtracting the proceeds to the date of payment and a blue line indicating the same NAV added to all revenues distributed to at each date. The first line is thus equivalent to the carrying amount corresponding to the market value, while the second one indicates the trend "total return" of the NAV and is therefore related to the black line.
Daily quote chart for the last year of the fund QFATL2
In the left side of every diagram there is the scale of the equivalent value exchanged in the market, expressed in thousands of euros, while to right there is the value of the fund in euro. The diagrams come weekly dawned.
For every graph there are represented the open, max, min and close values recorded in the market for each week or day (green and dark red bars) and the course of the values of the closes added to the distributed dividends (black line), that is the "total return" course of an investment in that fund and the course of an index of reference with 6% annual yield (light green line).
Added two new lines: a dark blue indicates the
adjusted NAV
, which is obtained from the last available NAV for each date by subtracting the proceeds to the date of payment and a blue line indicating the same NAV added to all revenues distributed to at each date. The first line is thus equivalent to the carrying amount corresponding to the market value, while the second one indicates the trend "total return" of the NAV and is therefore related to the black line.
|
Would you like to be available on the site other information? Demand them here .
We will try to realize the best ideas that will come to us proposed. | |
|